
 ACCESS
Research Article
ACCESS
Research Article
Volume 1, Article ID: 2025.0007

Emanuelle S. Prudente
emanuelleprudente4@gmail.com


Matheus M. dos Santos
matmagno3@gmail.com


Gabriela V. Pantoja
gabivieirapantoja@gmail.com


Fernanda W. F. Bezerra
fernandawarissf@gmail.com


Andrea Komesu
andrea.komesu@unifesp.br


Gustavo G. Fontanari
gustavo.fontanari@ufra.edu.br


Luiza H. S. Martins
luiza.martins@ufra.edu.br

1 Instituto de Saúde e Produção Animal (ISPA), Universidade Federal Rural da Amazônia (UFRA), Belém 66077-830, PA, Brazil
2 Programa de Pós-Graduação em Ciência e Tecnologia de Alimentos (PPGCTA), Universidade Federal do Pará (UFPA), Belém 66075-110, PA, Brazil
3 Instituto do Mar, Universidade Federal de São Paulo (UNIFESP), Santos 11070-100, SP, Brazil
* Author to whom correspondence should be addressed
Received: 11 Jul 2025 Accepted: 11 Aug 2025 Available Online: 12 Aug 2025 Published: 22 Sep 2025
Pracaxi is an Amazonian oil widely valued in industry for its biological properties. However, its processing generates a biomass that is frequently accumulated without adequate disposal. This material is a source of phytochemicals with high biological activity. Design of Experiments (DOE) is a useful approach for optimizing processes by controlling influencing variables without the need for numerous tests. This work aimed to optimize the ultrasound-assisted extraction of bioactive compounds (Total phenolic compounds -TPC, Total flavonoids- TF and antioxidant activity—AA) from pracaxi biomass residue through an axial 23 experimental design, with desirability function and Response Surface Methodology (RSM), the effects studied were: extraction time in ultrasound (min) (x1), solid-liquid ratio (% m/v) (x2) and ethanol concentration (% v/v) (x3), the dependent variables were TPC, TF and AA. The experimental design revealed that variables with the most significant effect in this study were x2, followed by x3 and x1. The theoretical optimal condition was achieved using the desirability function, yielding an overall value of D = 71.57%, under the following conditions: 0.85 mg GAE/g for TPC, 0.028 mg QE/g, and 92 µmol ET/g of sample. The experimental values obtained achieved error values of 10.23%, 3.57% and 13.28%, respectively. These results indicate that the obtained model can be considered satisfactory. The use of ethanol with ultrasound-assisted extraction is an efficient and economically viable technique for obtaining bioactive compounds from pracaxi, offering the potential to valorize a residue from the Amazon and contribute to the circular economy.

Ultrasound-assisted extraction was optimized for bioactives from pracaxi residues. Solid–liquid ratio was the most influential factor in extraction efficiency. The process used ethanol, a green solvent, aligning with sustainable practices. The method adds value to Amazonian biomass and supports the circular bioeconomy.
The Brazilian Amazon is rich in its biodiversity. Among the potential raw materials are forest extraction products, such as andiroba, copaiba, and pracaxi (Pentaclethra macroloba (Willd.)) oils, with the latter gaining prominence in the pharmaceutical and cosmetics industries, with potential in the dermatological and hair sectors [1,2]. Pentaclethra macroloba (Willd.) belongs to the Fabaceae family [3]. This oilseed is common in the Amazon region, with trees reaching heights of up to 14 m and diameters of up to 59 cm [4]. Its fruits are dark green, but during ripening they become a more intense green [5]. Pracaxi oil is among the most valued products in the pharmaceutical and cosmetic industries due to its distinctive biological properties. Its composition includes several fatty acids, including 53% oleic acid and 16% behenic acid, as well as linoleic and lignoceric acids [6,7]. Processing of oilseeds in the food, cosmetics, pharmaceutical, and biodiesel industries generates by-products and waste that are often accumulated without proper disposal. In general, this waste is used to produce organic fertilizers or for animal feed [8]. Phytochemicals, found naturally in plants, have beneficial effects on human health, such as phenolic acids (gallic, hydroxybenzoic, caffeic, coumaric, ferulic and ellagic) and their derivatives, and flavonoids (catechin, epicatechin, myricetin, quercetin and kaempferol), these compounds being of interest mainly to the chemical and pharmaceutical industry [9]. The phytonutrient sector, encompassing these compounds, generated around 5.2 billion USD in 2018 and is forecast to expand at a compound annual growth rate of 7.3% until 2024 [10]. The economic benefits derive from their biological characteristics, such as antioxidants, immunostimulants, antimicrobial, and anticarcinogenic agents [11]. Agro-industrial waste is generally a problem for processing industries, and as such, is often disposed of incorrectly in the environment, generating negative environmental impacts. These materials are sources of phytochemicals such as phenolic compounds, flavonoids, pigments, among others, which possess high antioxidant activity [12]. Conventional techniques for extracting phenolic compounds, such as reflux and maceration, require more time and high temperatures, which can degrade the compounds [13]. Ultrasound-assisted extraction, investigated as an alternative technique, provides benefits including shorter extraction times, lower temperatures, and enhanced efficiency in recovering active compounds [14,15]. Ethanol, considered environmentally friendly and approved by the FDA, is an effective solvent in the extraction of phenolic compounds and is often used in mixtures with water [16]. The use of ultrasound in extraction promotes cavitation, a phenomenon in which waves generate cycles of compression and expansion that rupture cell walls, facilitating solvent entry and improving mass transfer, which increases the release of target compounds. This ultrasonic energy can be applied via a water bath or directly into the sample. Maintaining temperature control is essential to safeguard heat-sensitive compounds. Considered an economical technique, ultrasound requires simple equipment, lower initial costs, and reduces extraction time [17,18]. Using Design of Experiments (DOE) to optimize processes is a promising approach, as it enables control over the variables influencing the process and allows clear identification of each factor’s effects and their possible interactions. By designing experiments systematically, it is possible to optimize a process or product, maximize yield, or reduce costs, without the need to perform several tests [19,20]. In this context, this work aimed to optimize the ultrasound-assisted extraction of phenolic compounds from pracaxi residue through a 23 experimental design with Response Surface Methodology (RSM), where the effects of the operational variables were evaluated: extraction time (min) solid-liquid ratio (% m/v) and ethanol concentration (% v/v), to maximize the extraction of the compounds of interest, as well as the effect of the application of ultrasound in the process.
2.1. Obtaining the Sample The pracaxi biomass (residue) (Figure 1, genetic heritage registry SISGEN code A2D84C7), kindly provided by AmazonOil (Ananindeua, PA), was used in this study. The biomass was ground in ball mills at the company itself and stored in polyethylene bags. Upon arrival at the Animal Nutrition Laboratory (LABNUTAN), the samples were organized, distributed in smaller polyethylene bags (around 1 kg each), and stored at room temperature (since the moisture content of the material was less than 10% at the time of analysis and all analyses). 2.2. Reagents and Equipment Used in Chemical and Instrumental Analyses 2.2.1. Reagent The following reagents were used: n-hexane 98% (Merck KGaA, Darmstadt, Germany; CAS 110-54-3), absolute ethanol (Merck, CAS 64-17-5), HPLC-grade acetonitrile (Sigma-Aldrich, CAS 75-05-8), Folin-Ciocalteu phenolic reagent (Sigma-Aldrich, CAS 631-69-6), gallic acid standard (Sigma-Aldrich, CAS 149-91-7), quercetin standard (Sigma-Aldrich, CAS 117-39-5), phosphoric acid (Sigma-Aldrich, CAS 7664-38-2), aluminum chloride (Sigma-Aldrich, CAS 7446-70-0), 2,2′-azino-bis(3-ethylbenzothiazoline-6-sulfonic acid) (ABTS, Sigma-Aldrich, CAS 30931-67-0) and standard Trolox (Sigma-Aldrich, CAS 53188-07-1). 2.2.2. Equipment Drying and Sterilization Ovens (Model SP-100—SPLABOR). Muffle Furnace (Model-SP 1200-SPLABOR). Nitrogen/Protein Distiller (Model MA-036—MARCONI). Lipids Extractor (Model XT10-ANKON). Ultrasonic tank 3.8 L frequency—40 kHz (Model—SSBu-P-Solidsteel). Centrifuge (Model 3K30—SIGMA). Rotary Vacuum Evaporator (Model MA-120-MARCONI). Freeze dryer (Model L108-LIOTOP). Spectrophotometer (Thermo Fisher Scientific Oy, Multiskan Go-SN-1530-8001397, Finland). A high-performance liquid chromatograph (Shimadzu, Japan) with an LC10AT controller, a DGU-14A pump coupled to a Rheodyne manual injector, and a UV/vis detector with SPD-M10A VP diode array was used. 2.3. Physicochemical Characterization of the Residue The biomass was characterized according to the protocol of the Official Methods of Analysis of the Association of Official Analytical Chemists (AOAC) [21], with the following analyses performed: moisture content, as per AOAC method no. 925.09 [21], lipids no. 925.38 of AOAC [21], crude protein no. 920.87 of AOAC [21], ash no. 923.03, AOAC [21]. All analyses were performed in triplicate. The data were tabulated, and the means and standard deviations were calculated, considering a coefficient of variation ≤ 10%. Results are expressed on a dry basis as g/100 g of pracaxi residue. 2.4. Biomass Degreasing To avoid interference from fat, the samples were decreased with n-hexane at a ratio of 1:6 (mass: volume or m/v) for 6 h under constant agitation, at room temperature [22]. After this period, the samples were crushed, sieved, and stored in plastic bags at room temperature until bioactive compound extraction analyses were performed. 2.5. Optimization of the Extraction of Bioactive Compounds Firstly, preliminary tests were carried out to choose the minimum and maximum extraction points; the extraction was based on the method of [23], with modifications. A 23 central composite design was employed with three independent variables: extraction time (min), solid-to-liquid ratio (% m/v), and solvent (ethanol) concentration (% v/v). The design included 8 factorial trials, 6 axial points, and 3 replicates at the central point, resulting in a total of 17 experiments. The dependent variables (responses) were the content of total phenolic compounds, total flavonoids, and antioxidant activity (ABTS assay). Table 1 presents the levels of each study variable. The levels of each study variable. Note: X1 = Extraction time (min); X2 = Solid-liquid ratio (%) m/v); X3 = Solvent concentration ((%) v/v). For the tests, the number of defatted samples was weighed with the solid-liquid ratio, ethanol concentration, and residence time according to the experimental design. The tests were performed in 250 mL Schott flasks subjected to a Solid Steel 3.8 L ultrasonic tank, 40 kHz, 35 °C. After the reactions were completed, the liquid fraction was separated from the solid fraction by centrifugation (SIGMA centrifuge) at 10,000× g at room temperature. The solid fraction was discarded, and the liquid fraction was stored in amber bottles for subsequent analysis of total phenolic compounds (TPC), total flavonoids (TF), and antioxidant activity using the ABTS assay. 2.5.1. Response Surface Methodology Response Surface Methodology (RSM) is a statistical and mathematical approach aimed at the analysis and optimization of processes with multiple independent variables influencing a response variable. This methodology, widely used in engineering, especially in the chemical area, allows the modeling and understanding of complex systems through response functions, being a valuable tool in experimental studies [24]. In this work, RSM was performed according to the Equations (1) and (2) [25,26]: Table 1:
 Variables
Levels
Code
−α 1.68
−1
0
+1
+α 1.68
X1
0.34
15
37.5
60
75.34
X2
0.1
5
1.25
2
2.5
X3
0.01
0.5
32.5
60
78.75
where Y represents the estimated response, b0 is the constant term, while bi, bii, and bij correspond to the linear, quadratic and interaction coefficients, respectively.
e: is the experimental error or residual, which represents the difference between the observed value and the value predicted by the model. It incorporates variations not explained by the model variables.
2.5.2. Desirability Function for Multi-Response Analysis
Process optimization using the desirability function (Df) is a widely employed technique that integrates Df analysis with Design of Experiments (DOE). It is a practical, consolidated, and easy-to-apply approach, not restricted to a specific type of optimization problem. This approach is especially valuable for optimizing several responses that have distinct objectives at the same time. Its main objective is to find the best set of input variables that allows all responses to come as close as possible to the desired values or established goals [26].
Since this work deals with multiple responses (in this case, 5), this work uses the calculation of desirability, different from the author’s original approach. The desirability function, proposed by Derringer and Suich [27], aims to identify a compromise condition in which all responses fall within a region considered desirable. Thus, the original responses are scaled between 0 (undesirable) and 1 (fully desirable).
The desirability function aims to find a compromise condition where all responses are within a region accepted as desirable. In this way, the original responses are coded between 0 (undesirable condition) and 100% (desirable condition) [27].
2.6. Analysis of Bioactive Compounds
2.6.1. Total Phenolic Compounds (TPC)
It was performed according to the methodology proposed by Singleton & Rossi [28], modified for microplates, where a reaction is performed in a 96-well microplate, in which 25 µL of extract was added, followed by the addition of 125 µL of Folin-Ciocalteu reagent at 10% (v/v), leaving the reaction to occur for 2 min. After this period, 100 µL of 7.5% (m/v) sodium carbonate solution was added, and the plate was placed in a spectrophotometer (Thermo Fisher Scientific Oy, Multiskan Go-SN-1530-8001397, Finland) with shaking for 30 seconds, followed by a 30-minute incubation. The absorbance reading was performed at a wavelength of 765 nm. The concentration of CFT in the extracts was determined from the equation of the straight line obtained in the standard curve of gallic acid (Sigma, 99% purity) (y = 0.0059x + 0.0929, R2 = 0.9996) and expressed in mg GAE/g of sample.
2.6.2. Total Flavonoids (TF)
FT contents in the extracts were quantified according to the method described by [29], with modifications. 115 μL of sample extract and 115 μL of 2% AlCl3 solution were added. The plate was then placed in the spectrophotometer, where it was shaken for 30 s and then left to stand for 10 min. The absorbance was then measured at 425 nm. The total flavonoid contents were calculated from a quercetin standard curve (y = 0.02x − 0.0047, R2 = 0.9987) and expressed in (mg QE/100 g).
2.6.3. Antioxidant Activity by the ABTS Method
The antioxidant capacity of the samples against the free radical ABTS•+ (2,2′-azino-bis (3-ethylbenzothiazoline-6-sulfonic acid)) was evaluated according to the methodology proposed by Rufino et al. [30]. The ABTS•+ cation was produced by the reaction of a stock solution of 7 mM ABTS (>98%, Sigma-Aldrich, Brazil) with 140 mM potassium persulfate (Neon, Brazil). The reactions were performed by transferring 30 µL of the sample to test tubes containing 3.0 mL of the ABTS•+ radical, and the reading was taken at 734 nm after 6 min of mixing. Quantification was performed using Trolox ((±)-6-hydroxy-2,5,7,8-tetramethylchroman-2-carboxylic acid, 97%, Sigma, Brazil) to construct the analytical curve (y = −0.0002x + 0.7055, R2 = 0.9902). From the equation of the straight line, the calculation was performed and expressed in micromoles of Trolox equivalent per gram of extract (µM Trolox equivalent/g of sample).
2.7. Identification of Phenolic Compounds by High-Performance Liquid Chromatography (HPLC)
A liquid chromatograph (Shimadzu, Japan) with an LC10AT controller, a DGU-14A pump coupled to a Rheodyne manual injector, and a UV/vis detector with SPD-M10A VP diode array was used. The compounds were analyzed at a wavelength of 254 to 280 nm. The software used was Real Time. The column used was the C18 XBridge BEH of 150 × 4.6 mm and 3.5 µm particles (Waters—Ireland) in reverse-phase. The injection volume was 20 µL, and the mobile phase gradient was: Solvent A, 0.1% TFA in MilliQ water; Solvent B, 0.1% TFA in 90% acetonitrile and 10% MilliQ water. Two HPLC-grade standard solutions of gallic acid and quercetin (Sigma-Aldrich) were injected to suggest the identification of the extract peaks. The total running time was 35 minutes. Our research group adapted this methodology only to suggest the molecules of phenolic compounds or flavonoids present in the analyzed extracts.
2.8. Statistical Analysis
Responses of the experimental design (total phenolic compounds, total flavonoids, and antioxidant activity) underwent analysis of variance, with the F regression test and F lack of adjustment test (considering the pure error) being performed to validate these data and generate response surfaces.
Analyses were performed using Statistica software (Version 7), and a 90% confidence level was adopted (p < 0.1).
3.1. Physicochemical Characterization of the Residue Table 2 presents the data on the centesimal composition of the pracaxi biomass. Centesimal composition of pracaxi biomass. Pracaxi biomass exhibited an interesting composition, with 13.12% moisture, 3.5% ash, 18.03% lipids, 12.1% proteins, and 66.37% carbohydrates. With a high content of lipids and carbohydrates, it is a promising source for industrial applications, such as the production of oils, cosmetics, and bioenergy. In addition, the low ash content and the appreciable amounts of proteins and carbohydrates suggest that it is a quality biomass with nutritional and functional potential. The results of this study were similar to those reported by Fonseca and Pereira [31], who found values of 21 ± 0.2 lipids, 21 ± 0.1 proteins, 12 ± 0.5 fibers, 2.5 ± 0.1 ash, 29 ± 0.1 carbohydrates and 14 ± 0.07 moisture, with a significant difference in the protein and carbohydrate contents when compared to this research. 3.2. Optimization of the Extraction of Bioactive Compounds Figure 2 shows the Pareto chart generated for the bioactive compounds and the influence of the studied factors (independent variables) on the responses (dependent variables), TPC (Figure 2a), TF (Figure 2b), and Antioxidant Activity (AA) by ABTS (Figure 2c). Figure 2a shows that the significant effects (p ≤ 0.1) influencing TPC extraction were, in order: the linear (L) and quadratic (Q) effects of solvent percentage, the quadratic (Q) effect of extraction time, and the interaction between the solid–liquid ratio and solvent concentration. When a linear effect is positive, it indicates a direct and proportional relationship with the independent variable and the response (dependent variable); when it is positive, it indicates that the increase of this variable leads to a rise in TPC concentration. In this work the TPC concentration had a significant and positive quadratic variable, this suggests that there is a non-linear relationship between the independent variable and the response, showing that there is the presence of a maximum region, and that an excessive increase or decrease of the independent variable can decrease TPC extraction, a positive quadratic value indicates the presence of an upward concavity in the graph and the non-linear relationship in the mathematical model. For Figure 2b, it was observed that only the linear effects of solid-liquid ratio (L) and solvent concentration (L) had a significant impact on the response. In addition, the quadratic effect of the solid–liquid ratio was also significant, indicating a positive value and the presence of a maximum region for this parameter. The impact of the solid-liquid ratio (L) had a negative value, indicating that with the increase in mass in the solid-liquid ratio, there is a decrease in response. The effect of the solid-liquid ratio was not significant for TPC, which suggests that specific factors are more unfavorable for this subgroup of bioactive compounds. Finally, Figure 2c shows the effects of the variables on the AA response by ABTS, indicating that the linear solvent (L), quadratic solvent (Q), quadratic extraction time (Q) and the solid-liquid and solvent interaction, both linear, had a value of p ≤ 0.1, which indicates that their effects were significant in the AA increase responses. If there is an increase in the solvent, there is an increase in the AA response. However, due to the presence of the quadratic region, there is a maximum production and also a non-linear relationship that must be considered. Guerra et al. [15] studied the effect of ultrasound-assisted extraction of phenolic compounds from the peel of Tommy Atkins mangoes, studying ethanol concentrations of 30, 50, and 70% (v/v), temperatures of 40, 50, and 60 °C, and extraction times of 30, 40, and 50 min through a Box-Behnken experimental design. The results showed that all variables evaluated had a positive effect on the extraction of phenolic compounds, except for the interaction between time and ethanol concentration. The authors achieved concentrations of up to 20.76 mg GAE/g of sample. The non-significant effects in the Pareto analysis were ignored, and Analysis of Variance (ANOVA) (Table 3) was performed to assess whether the mathematical models can be considered significant and predictive. For this, two F tests were performed: one related to regression (Fregression) and the other related to lack of fit (Flackoffit). The difference between them is that Fregression assesses whether the regression model is statistically significant, that is, whether the model coefficients (independent variables) significantly explain the variation in the dependent variable. Flackoffit will assess the adequacy of the adjusted model to the experimental data, considering the residuals and pure errors. In this research, the analysis was made considering the pure error; it was necessary to perform both analyses to assess the relevance of mathematical models at the time of adjustment. Analysis of variance (ANOVA) and F tests for the design of experiments of ultrasound-assisted extraction of pracaxi biomass. QS = quadratic sum; Df = degree of freedom; QM = quadratic mean; TPC = Total Phenolic Compound; TF = Total flavonoids and AA Antioxidant activity by ABTS. For a mathematical model to be considered significant and predictive, the tabulated Fregression must be greater than the calculated F, while the calculated Flackofadfit must be less than the tabulated F for lack of fit. In this context, we can observe that for TCP tabulated Fregression for a df of 4 and 12, the value was 2.48 (p ≤ 0.1) and the calculated Fregression was 3.86. For the lack of fit F, the tabulated value for a df of 12 and 2 was 9.39 (calculated F = 5.40). This implies that for AA, the mathematical model passed the test, being considered significant and predictive. Also, for TF, the tabulated Fregression for a df of 2 and 14, the value was 2.73 (p ≤ 0.1), and the calculated Fregression was 10.49. For the lack of fit F, the tabulated value for a df of 10 and 2 was 19.41 (calculated F = 4.02). This implies that for AA, the mathematical model passed the test, being considered significant and predictive. Regarding AA, the tabulated Fregression for a df of 4 and 12, the value was 2.48 (p ≤ 0.1), and the calculated Fregression was 3.84. For the lack of fit F, the tabulated value for a df of 10 and 2 was 9.39, and the calculated F was 5.29. This implies that for AA, the mathematical model passed the test, being considered significant and predictive. The ANOVA analysis indicated that all models passed the F tests for regression analysis and lack of fit. The mathematical models were then considered significant and predictive. The mathematical models follow a polynomial equation and can be seen in Equations (3)–(5) below in the order TPC, TF, and AA, respectively.Table 2: Determination (g/100 g)
Pracaxi Biomass
Variation Coefficient (%)
Moisture
13.12 ± 0.26
1.98
Ash
3.5 ± 0.05
1.42
Lipids
18.03 ± 0.21
1.16
Proteins
12.1 ± 0.14
1.60
Carbohydrates
66.37
-
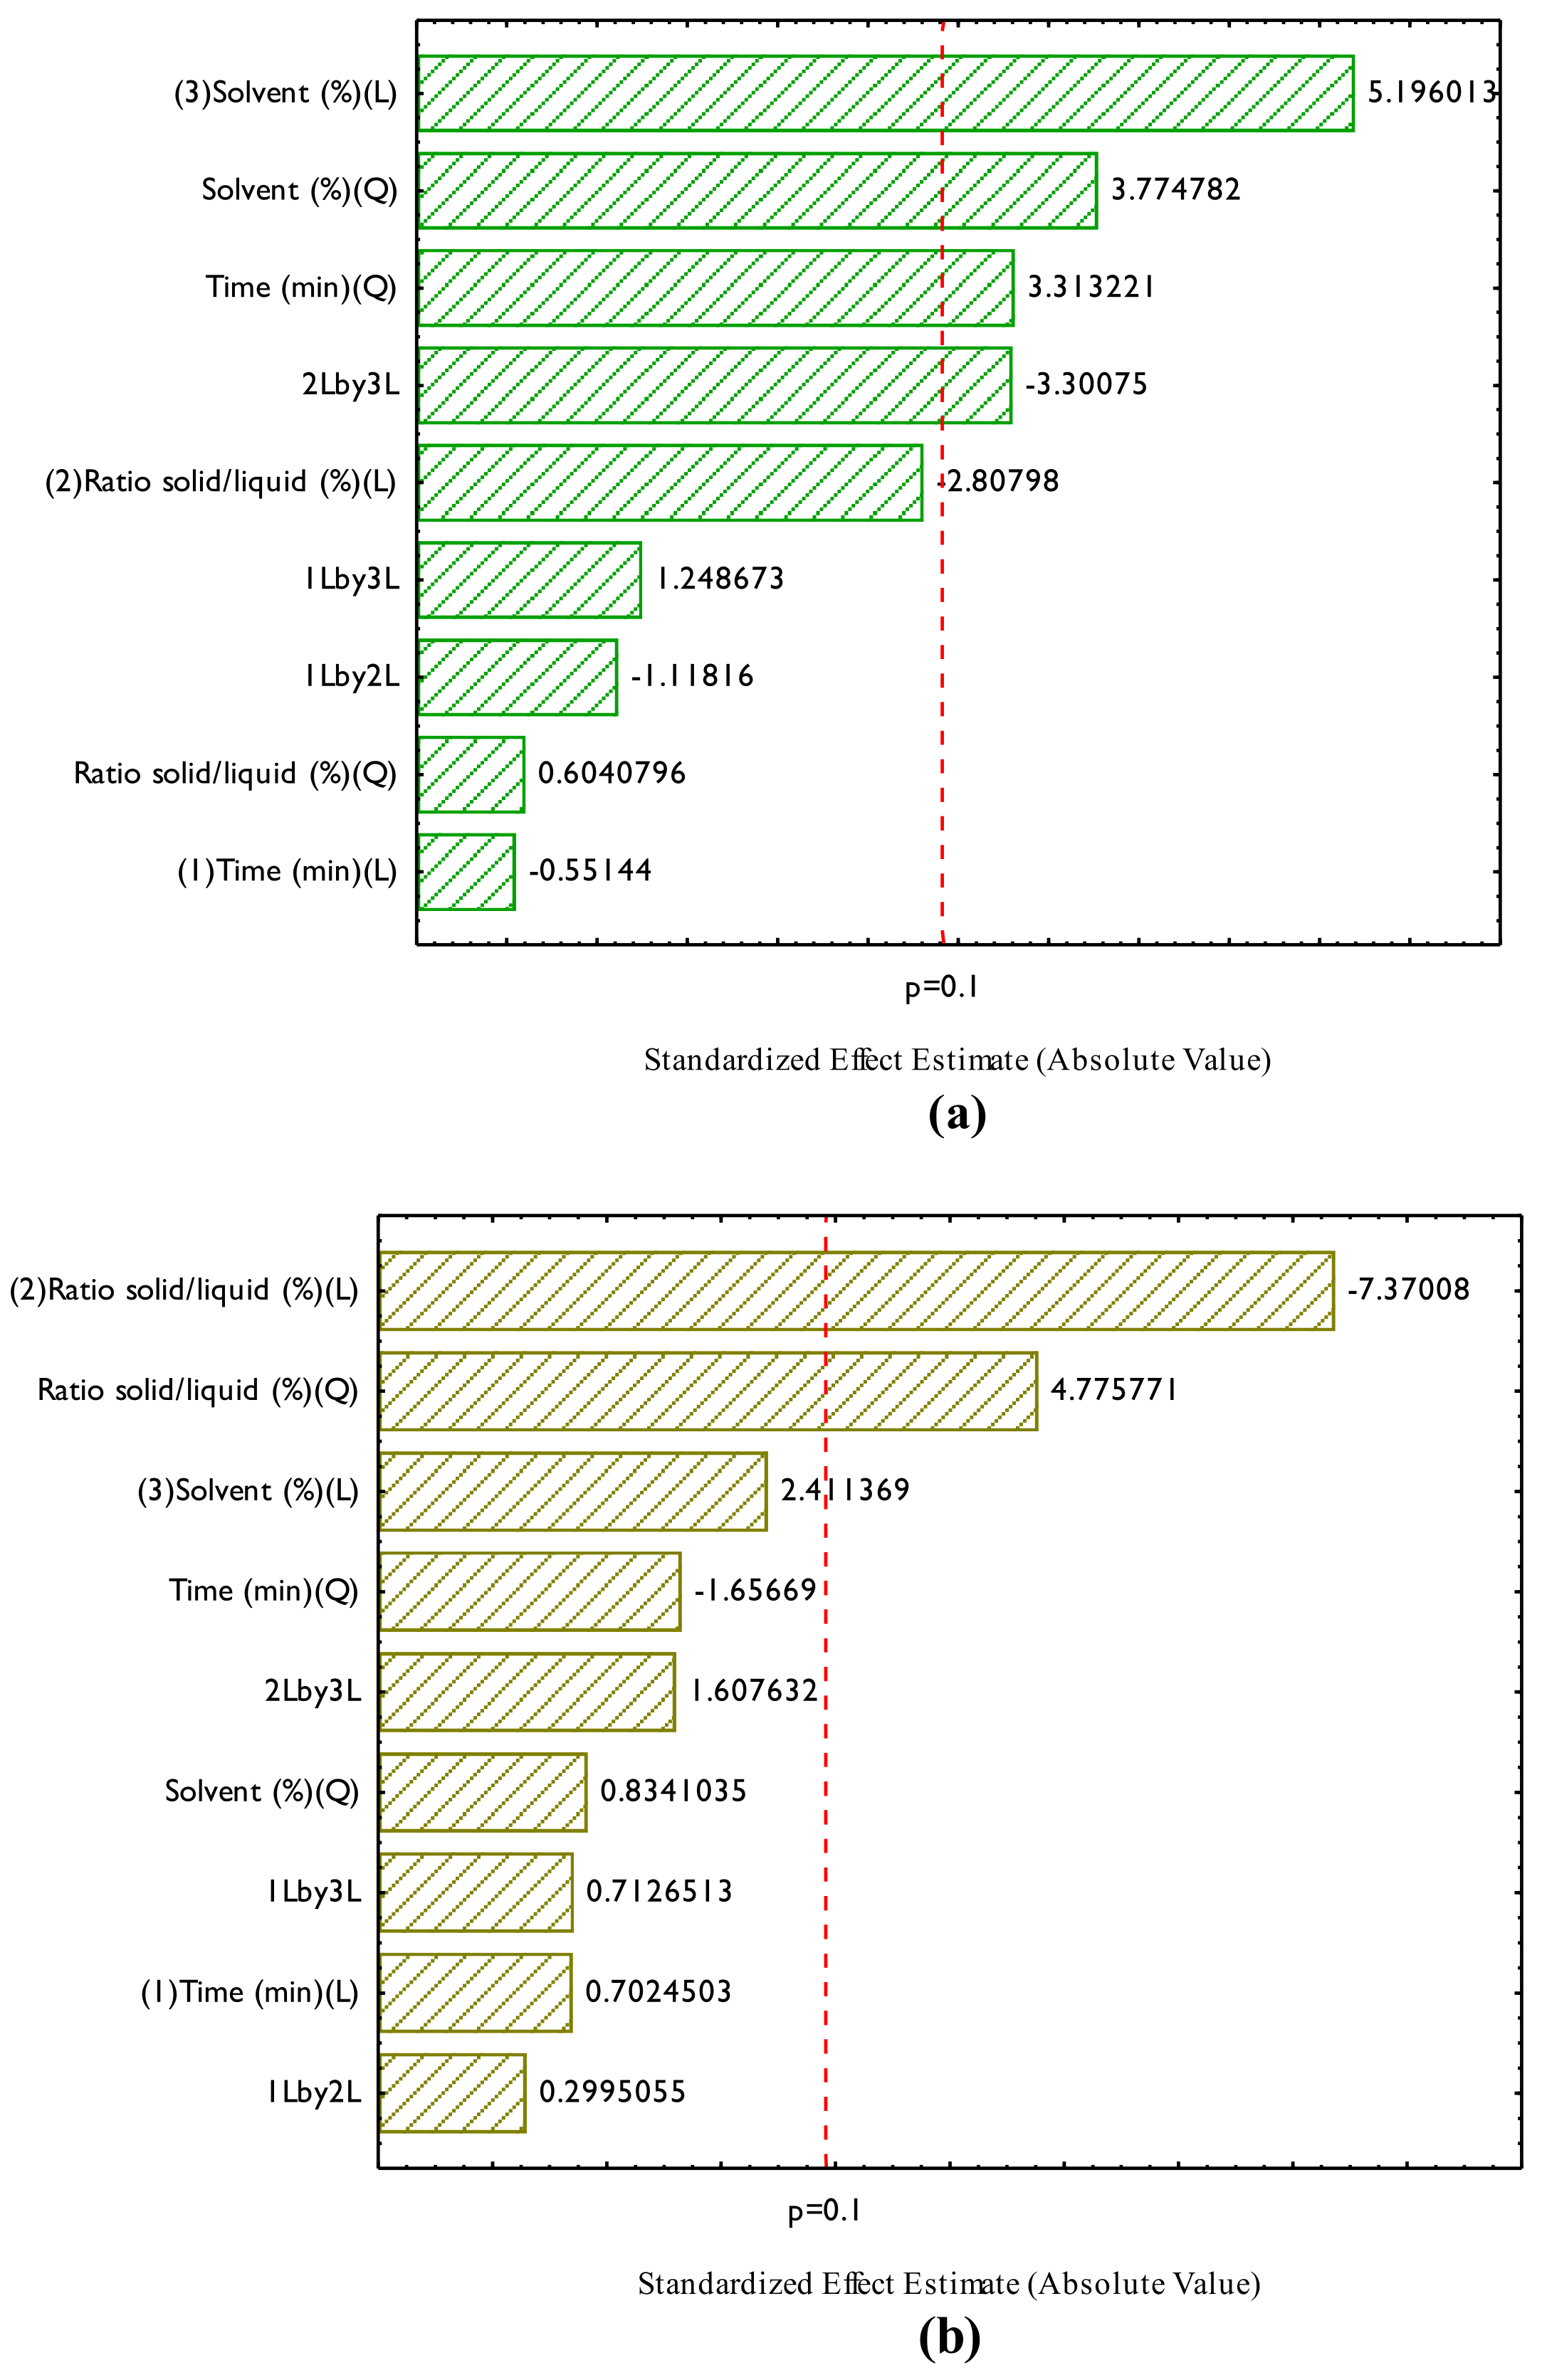
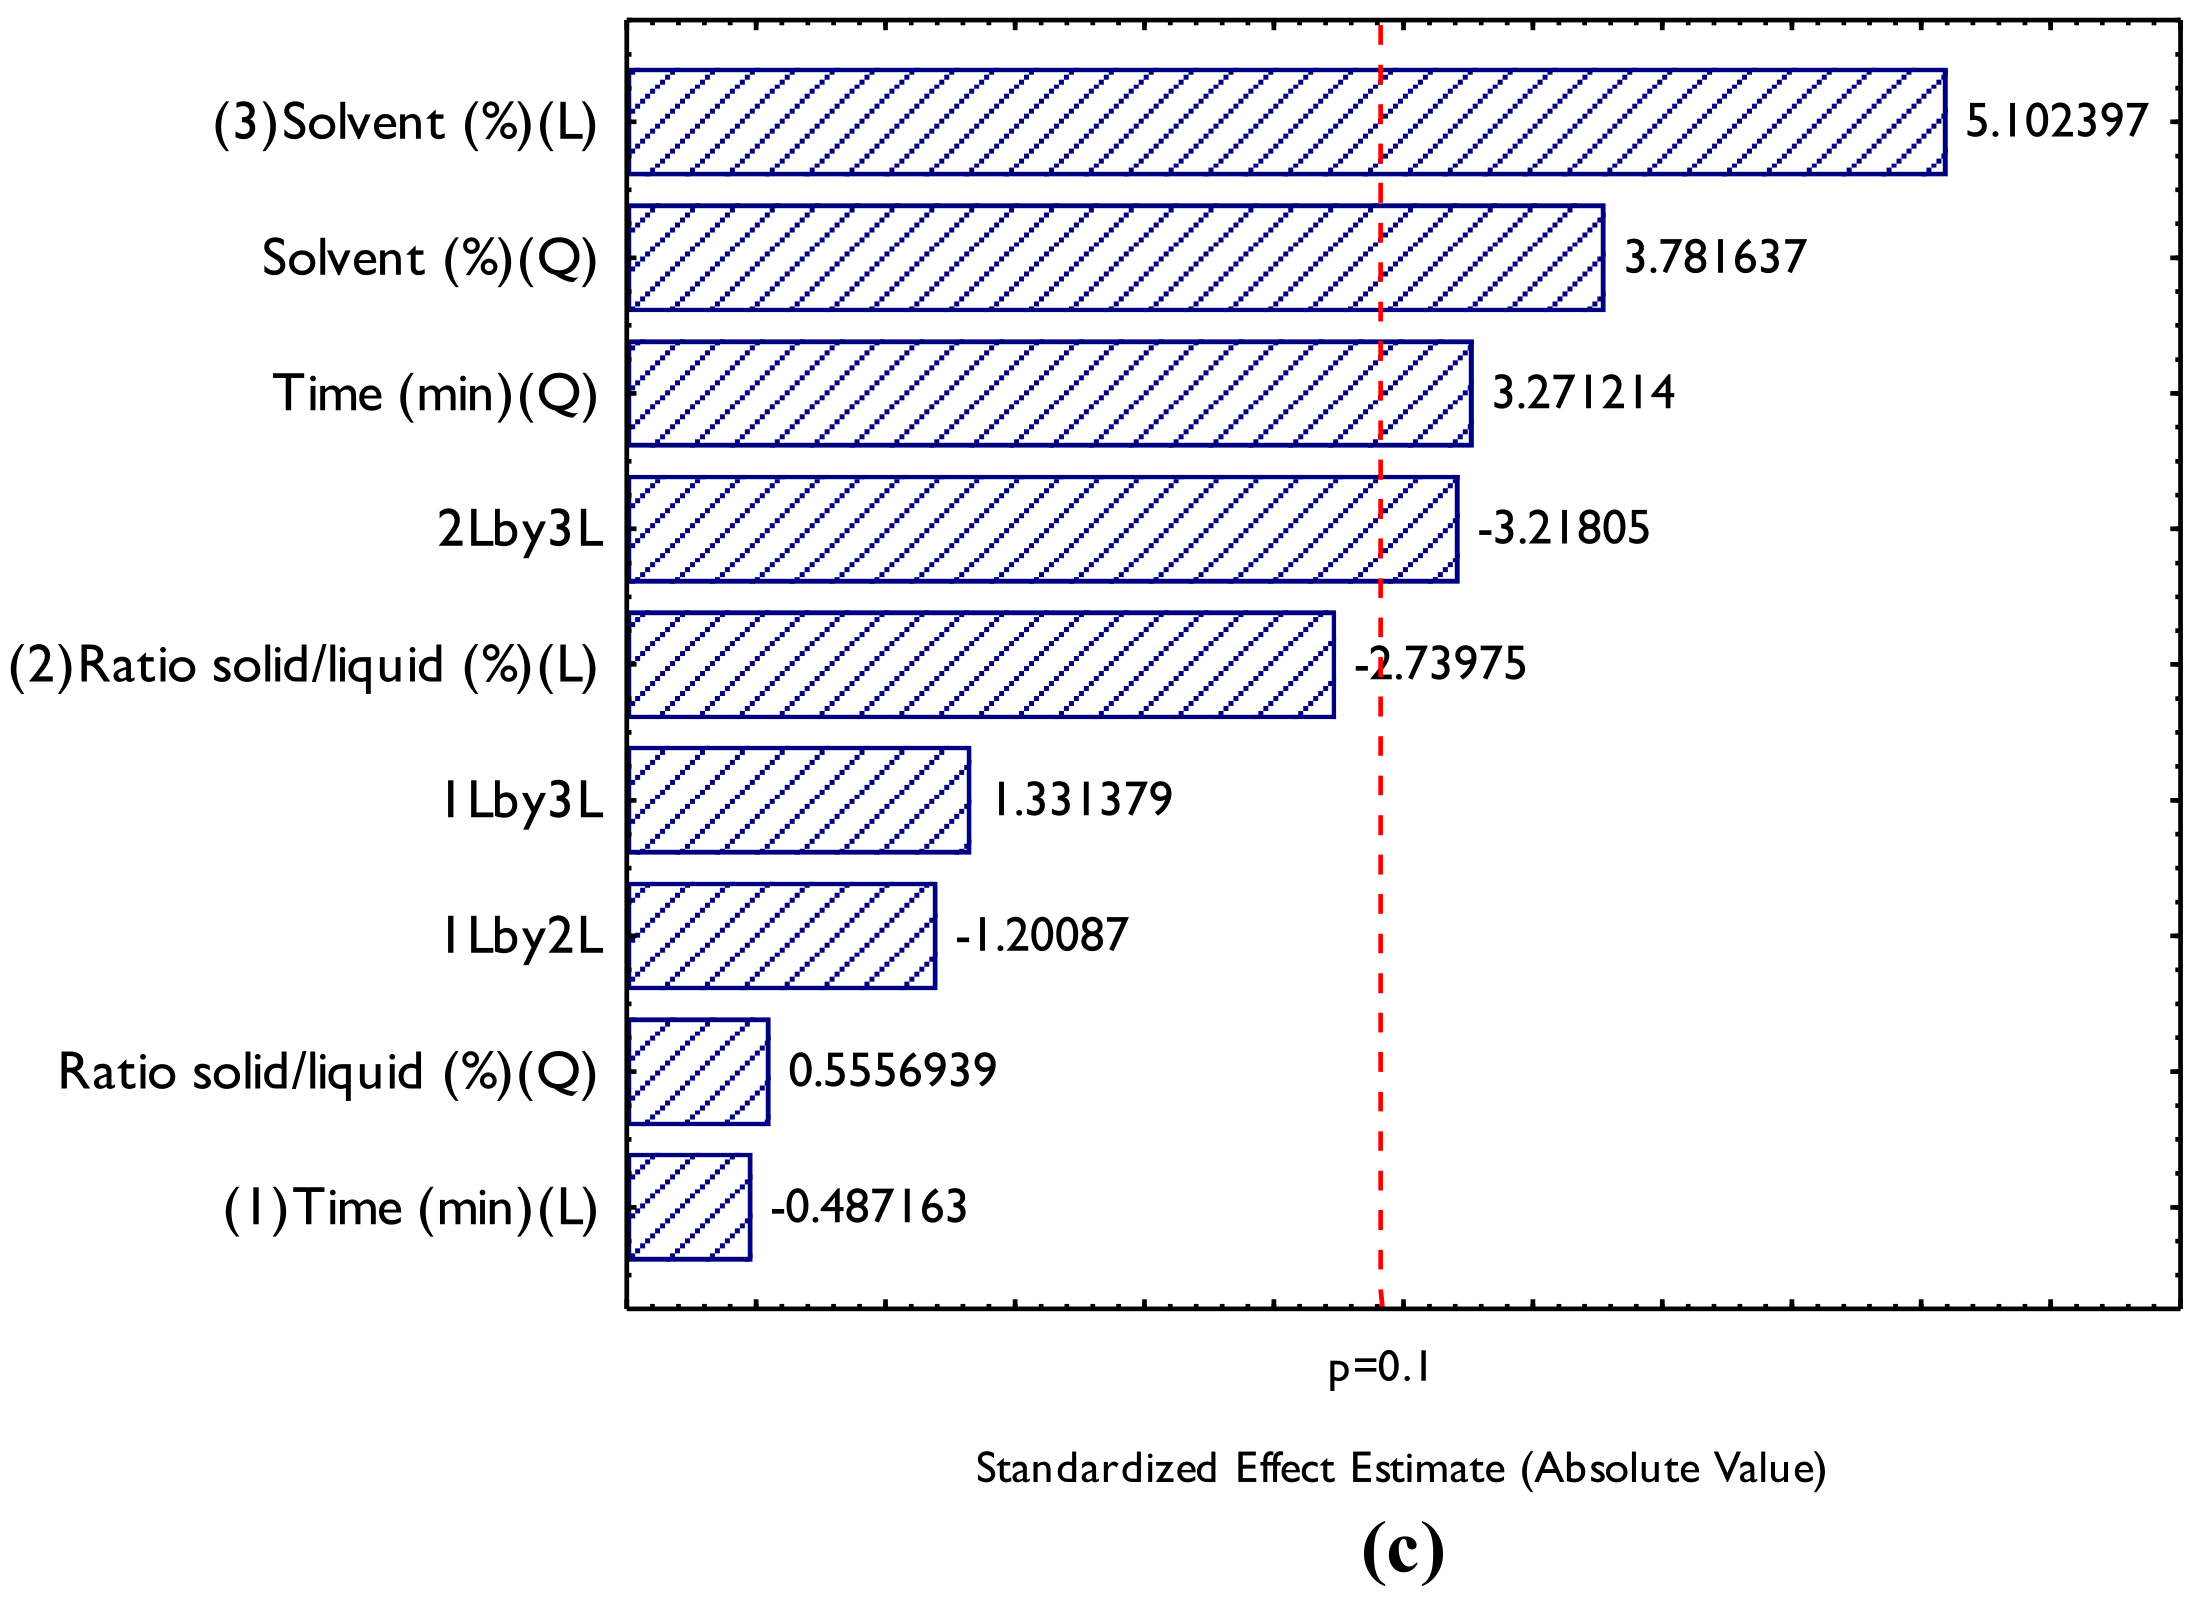 Table 3:
 Source of Variation
TPC
Effects
QS
Df
QM
Fregression
Flackoffit
Regression
0.6218
4
0.1554
3.86
5.40
Residue
0.4833
12
0.0403
Lack of fit
0.466020
10
0.046602
Pure error
0.017267
2
0.008633
Total
56.27
-
-
% variation explained
98.44
-
-
Maximum % explainable variation
-
-
TF
Regression
0.0013
2
0.0007
10.49
4.02
Residue
0.0009
14
0.0001
Lack of fit
0.000847
12
0.000071
Pure error
0.000035
2
0.000018
Total
0.002205
16
-
% variation explained
59.97
-
-
Maximum % explainable variation
98.41
-
-
AA
Regression
11,555.8111
4
2888.9528
3.84
5.29
Residue
9030.8882
12
752.5740
Lack of fit
8701.95
10
870.195
Pure error
328.93
2
164.467
Total
20,586.70
16
-
% variation explained
56.27
-
-
Maximum % explainable variation
98.44
-
-
* Note: X1 = Extraction time (min); X2 = Solid-liquid ratio (%) m/v); X3 = Solvent concentration (%) v/v).
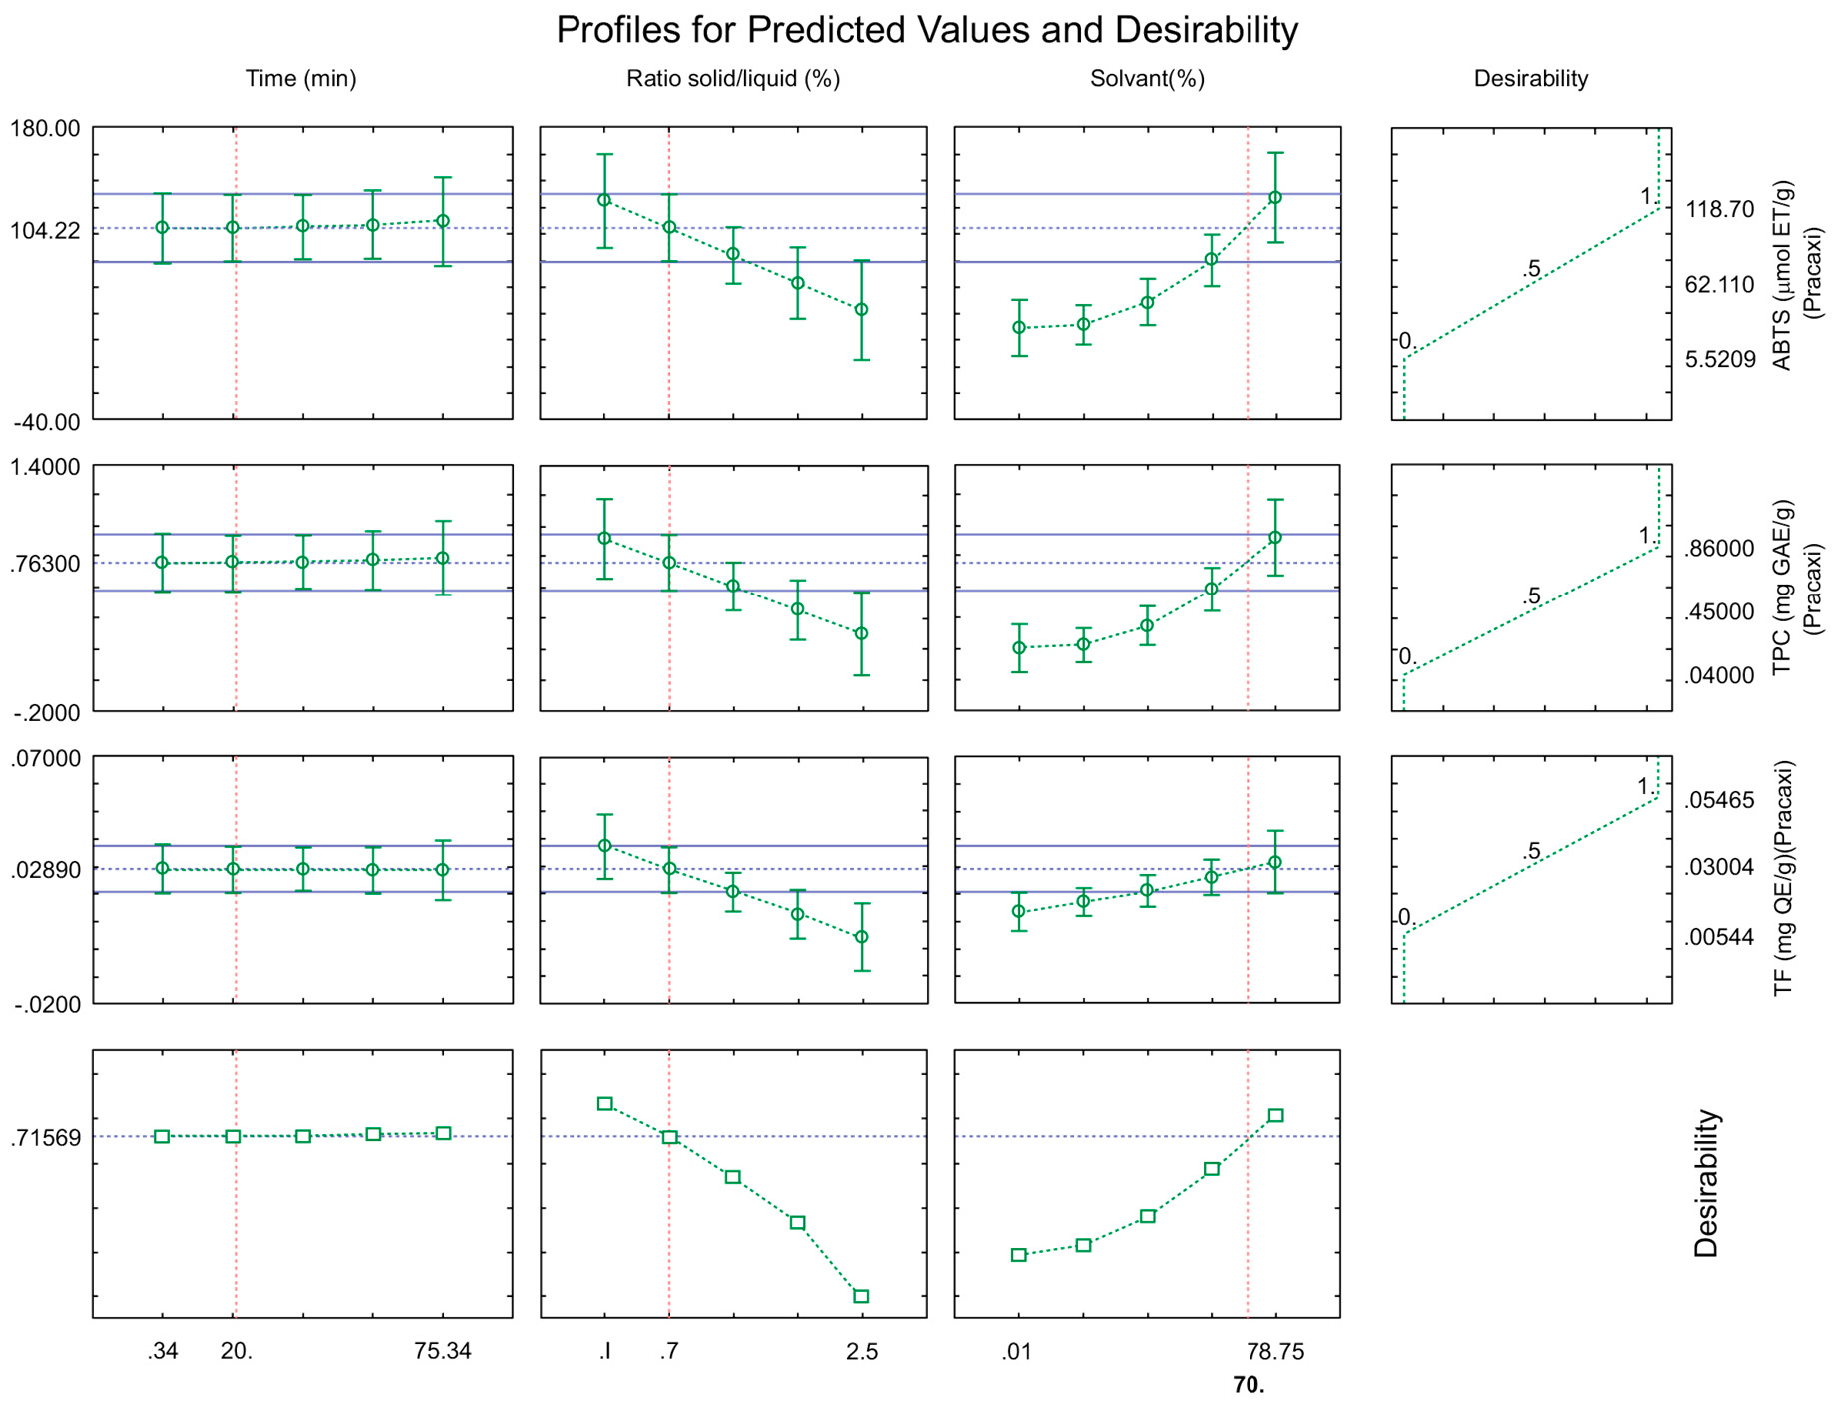
To determine the optimum extraction point, the desirability function was used, as shown in Figure 3. The optimum condition determined was an extraction time of 20 min, a solid-liquid ratio of 0.7% (m/v), and an ethanol concentration of 70% (v/v), with an overall desirability value of D = 71.57%, which indicates a good condition [27].
After this analysis, the contour surfaces were generated for all variables studied, considering the overall desirability, which are shown in Figure 4.

According to Figure 3, it can be observed that, in general, the variables that had the most significant effect on the extraction of bioactive compounds were the solid-liquid ratio, followed by the solvent concentration and extraction time.
In this study, values of approximately 0.763 mg GAE/g for TPC, 0.029 mg QE/g, and 104.22 µmol ET/g of sample were obtained. These data were obtained through the mathematical model of optimization by the desirability tool. This condition was performed at the laboratory where the following experimental values were obtained: 0.85 mg GAE/g; 0.028 mg QE/g and 92 µmol ET/g, with error values of 10.23%, 3.57% and 13.28%. The results indicate that the model obtained can be considered satisfactory to explore the potential of the pracaxi biomass.
Another experiment was carried out under the same conditions, but using 70% (v/v) methanol and a thermostatic bath (Quimis Dubnoff), subjecting the reaction for one hour at a temperature of 50ºC, and then quantifying only the TPC, obtaining values of 0.90 mg/g ± 15.01, indicating that the use of ethanol with assisted ultrasound is an efficient technique for the extraction of bioactive compounds from pracaxi, being economically viable because it uses less time, more mass and a green solvent, which will not cause damage to the environment, in addition to having the possibility of valuing a residue from the Amazon, contributing to the circular economy.
Comparing these findings with the literature, Mohammadnezhad et al. [32] employed supercritical fluid extraction (SFE) with CO2 to obtain lipid fractions from pracaxi nuts. Their results indicated that temperature had a significant effect on the extraction yield, total phenolic content, and bioactivity. However, they noted that higher extraction yields did not always correlate with greater bioactivity. Under optimized conditions, their extracts contained 91.9 ± 0.9 mg GAE/g (80% EtOH) and 103.9 ± 0.5 mg GAE/g (12.5% EtOH) for TPC, with TF values of 6.6 ± 0.2 mg QE/g and 7.0 ± 0.1 mg QE/g, respectively.
Additionally, Eberhart et al. (2023) [33] analyzed the total phenolic composition in pracaxi oil, reporting a value of 67.43 mg GAE/kg. Teixeira et al. (2020) [34] found phenolic contents ranging from 31.92 to 54.05 mg GAE/kg in pracaxi oil. Such variations can be attributed to environmental factors, including climate, geographic location, humidity, and harvest time, as well as differences in extraction techniques, which can influence the final composition of bioactive compounds [34].
While the values reported in the literature for pracaxi-based extracts are generally higher than those obtained in the present study, it is important to consider differences in extraction methodologies and sample types. The ultrasound-assisted extraction with ethanol used here offers advantages in terms of process efficiency, environmental sustainability, and economic viability, reinforcing its potential for large-scale application.
3.3. Chromatogram by High-Performance Liquid Chromatography (HPLC)
Figure 5 displays the results of a High-Performance Liquid Chromatography (HPLC) analysis, showing the separation of a mixture’s components over time. Each peak represents a different compound, with the largest peak likely being Catechin.

The sharp peak for catechin indicates a clean separation, and its height suggests a significant amount in the sample. To further confirm the presence of catechin, additional analytical techniques can be employed, such as mass spectrometry (MS) and nuclear magnetic resonance (NMR).
Catechin is a type of flavanol, known for its potential health benefits, including protection against cell damage, heart disease, cancer, diabetes, and neurodegenerative diseases. It may help support cognitive function. Ongoing research aims to fully substantiate the health benefits of catechin; however, current evidence indicates that it is a promising natural compound with potential positive effects on human health.
This study demonstrated that pracaxi biomass has a significant number of bioactive compounds, such as phenolic compounds and flavonoids, which have antioxidant activity. The optimization of the ultrasound-assisted extraction process, using the 23 experimental designs with Response Surface Methodology (RSM) and desirability function, enabled the determination of the optimal conditions for extracting these compounds, with an extraction time of 20 min, a solid-liquid ratio of 0.7% (m/v), and an ethanol concentration of 70% (v/v). The results obtained in this study show that pracaxi biomass is a promising source of bioactive compounds for the food, pharmaceutical, and cosmetic industries, and that ultrasound-assisted extraction is an efficient and sustainable technique for obtaining these compounds. Future work will focus on performing mass spectrometry analyses to rigorously identify the bioactive molecules in these extracts, thereby supporting the bioeconomy and sustainable development of the Amazon.
| AA | Antioxidant Activity |
| ABTS | 2,2′-azino-bis (3-ethylbenzothiazoline-6-sulfonic acid) |
| ANOVA | Analysis of Variance |
| DOE | Design of Experiments |
| FDA | Food and Drug Administration |
| GAE | Gallic Acid Equivalent |
| HPLC | High-performance Liquid Chromatography |
| MS | Mass Spectrometry |
| NMR | Nuclear Magnetic Resonance |
| QE | Quercetin Equivalent |
| RSM | Response Surface Methodology |
| TF | Total Flavonoids |
| TFA | Trifluoroacetic Acid |
| TPC | Total Phenolic Compounds |
Data curation, Investigation: E.S.P.; Investigation: M.M.S., G.V.P.; Writing—original draft: F.W.B.; Investigation, Supervision: G.G.F.; Writing—review & editing: A.K.; Writing—original draft, Writing—review & editing, Supervision, Formal analysis: L.H.S.M.; Designing and Visualization of Figures: L.H.S.M. All authors have read and agreed to the published version of the manuscript.
Data supporting the results of this study are available upon request from the corresponding author.
No consent for publication is required, as the manuscript does not involve any individual personal data, images, videos, or other materials that would necessitate consent.
The authors declare there is no conflicts of interest for this work.
This study was funded by CNPq Foundation (Brazil) research grant N° 408023/2021-0, and FAPESPA (Fundação Amazônia de Amparo a Estudos e Pesquisas) research grant N° 2023/557732.
The authors wish to thank Amazon Oil (Ananindeua, PA, Brazil), for providing samples, to CNPq Foundation (Brazil) research grant N° 408023/2021-0, and FAPESPA (Fundação Amazônia de Amparo a Estudos e Pesquisas) research grant N° 2023/557732 for financial support, and Sirs Ricardo, Igor e Chiquinho, for laboratory support. The authors and the Foundations have no conflict of interest regarding this manuscript. Also, we thank Proped-UFRA for granting scholarships to scientific initiation students.
[1] Barbosa, A.F.S.; Pastana, S.T.G. Amazonia: A Portfolio of Value for the Bioeconomy. Obs. Econ. Latinoam. 2024, 22, e4519. [CrossRef]
[2] de Queiroz Hermino, v.l.; Silva, E.P.; De Abreu, E.R.; Mota, D.N.; Neves, S.M.; Torres, V.G.S.; De Freitas, F.A.; Júnior, N.P. Use of Agro-Industrial Waste from the Processing of Oilseeds and Amazonian Fruits. Food Sci. Technol. 2025, 45, 1–9. [CrossRef]
[3] Dantas, A.R.; Marangon, L.C.; Guedes, M.C.; Feliciano, A.L.P.; Lira-Guedes, A.C. Spatial Distribution of a Population of Pentaclethra macroloba (Willd.) Kuntze in a Floodplain Forest of the Amazon Estuary. Rev. Arvore 2017, 41, e410406. [CrossRef]
[4] Silva, J.; Duringa, M. Pracaxi (Pentaclethra macroloba): Tree with Great Extractive Potential, Yet Neglected in the State of Roraima. IX Symposium Brazilian Sustainable Agriculture ; UFV: Viçosa, Brazil, 2018; . https://agris.fao.org/search/en/providers/122419/records/6474a9d86dd82759be7a8b23..
[5] Condé, T.M.; Tonini, H. Phytosociology of a Dense Ombrophilous Forest in Northern Amazonia, Roraima, Brazil. Acta Amaz. 2013, 43, 247–259. [CrossRef]
[6] Oliveira, W.S.; Da Silva, J.A.M.; Rocha, C.A.M. Scientific and Technological Prospection of the Use of Pracaxi Oil. Cadernos De Prospecção 2019, 12, 1560–1571. [CrossRef]
[7] Mattiazzi, J. Development of Nanostructured Systems Based on Pracaxi Oil Containing Ubiquinone. Master’s Thesis, Universidade Federal de Santa Maria, Recife, Brazil, 2014. https://www.researchgate.net/profile/Mariana-Monteiro-12/publication/373171558_EBOOK_DO_II_WORKSHOP_DO_PROGRAMA_DE_POS-GRADUACAO_EM_CIENCIA_E_TECNOLOGIA_FARMACEUTICA_CTECFAR_DA_UFRJ_TENDENCIAS_E_DESAFIOS_DO_MERCADO_COSMETICO/links/64de2fa6caf5ff5cd0c33ddc/EBOOK-DO-II-WORKSHOP-DO-PROGRAMA-DE-POS-GRADUACAO-EM-CIENCIA-E-TECNOLOGIA-FARMACEUTICA-CTECFAR-DA-UFRJ-TENDENCIAS-E-DESAFIOS-DO-MERCADO-COSMETICO.pdf#page=108..
[8] Ramos, A.F.O. Oilseed Cakes, Oils, and Plant Extracts from the Amazon in Rumen Fermentation. Ph.D. Thesis, Universidade Federal Rural da Amazônia, Belém, Brazil, 2018. https://pesquisa.bvsalud.org/portal/resource/pt/vtt-215076..
[9] Vizzotto, M.; Pereira, M.C. Blackberry (Rubus sp.): Optimization of the Extraction Process for the Determination of Phenolic Antioxidant Compounds. Rev. Bras. Frutic. 2011, 33, 1209–1214. [CrossRef]
[10] Market Data Forecast (n.d.). Phytonutrients Market by Application (Food and Beverages, Feed, Cosmetics and Pharmaceuticals), by Source (Fruits and Vegetables, Herbs and Trees, Cereals, Pulses and Oilseeds, and Other Sources), by Type (Carotenoids, Phytosterols, Flavonoids, Phenolic co). Available online: https://www.marketdataforecast.com/market-reports/phytonutrients-market (accessed on 21 July 2024).
[11] Tanase, C.; Coșarcă, S.; Muntean, D.-L. A Critical Review of Phenolic Compounds Extracted from the Bark of Woody Vascular Plants and Their Potential Biological Activity. Molecules 2019, 24. 1182 [CrossRef] [PubMed]
[12] Oleszek, M.; Kowalska, I.; Bertuzzi, T.; Oleszek, W. Phytochemicals Derived from Agricultural Residues and Their Valuable Properties and Applications. Molecules 2023, 28. 342 [CrossRef]
[13] Shao, P.; Zhang, J.F.; Chen, X.X.; Sun, P.L. Microwave-Assisted Extraction and Purification of Chlorogenic Acid from by-Products of Eucommia ulmoides Oliver and Its Potential Anti-Tumor Activity. J. Food Sci. Technol. 2014, 52, 4925–4934. [CrossRef] [PubMed]
[14] Bhadange, Y.A.; Carpenter, J.; Saharan, V.K. A Comprehensive Review on Advanced Extraction Techniques for Retrieving Bioactive Components from Natural Sources. Acs Omega 2024, 9, 31274–31297. [CrossRef]
[15] Guerra, A.P.; Dos Santos Garcia, V.A.; Da Silva, C. Optimization of the Extraction of Phenolic Compounds from Mango Peel (Tommy Atkins) Using an Ultrasound-Assisted Process. E Xacta 2016, 9, 103. [CrossRef]
[16] Ramírez-Brewer, D.; Quintana, S.E.; García-Zapateiro, L.A. Modeling and Optimization of Microwave-assisted Extraction of Total Phenolics Content from Mango (Mangifera indica) Peel Using Response Surface Methodology (RSM) and Artificial Neural Networks (ANN). Food Chem. X 2024, 22, 101420. [CrossRef]
[17] Nwokocha, B.C.; Chatzifragkou, A.; Fagan, C.C. Impact of Ultrasonication on African Oil Bean (Pentaclethra Macrophylla Benth) Protein Extraction and Properties. Foods 2023, 12. 1627 [CrossRef]
[18] De Oliveira, S.H.; Dos Santos Rolim, C.S.; Alves, T.C.L.; Dos Santos, C.L.; Lotas, K.M.; Do Nascimento, I.S.; Rolim, L.D.N.; Pereira, A.M.; Bonomo, R.C.F. Ultrasound-Assisted Extraction and Characterization of Brazil Nut Oil (Bertholletia excelsa). Sustain. Chem. Environ. 2025, 9, 100218. [CrossRef]
[19] Živković, J.; ? avikin, K.; Janković, T.; Ćujić, N.; Menković, N. Optimization of Ultrasound-Assisted Extraction of Polyphenolic Compounds from Pomegranate Peel Using Response Surface Methodology. Sep. Purif. Technol. 2018, 194, 40–47. [CrossRef]
[20] Cochran, W.G. Experiments for Nonlinear Functions (R.A. Fisher Memorial Lecture). J. Am. Stat. Assoc. 1973, 68, 771–781. [CrossRef]
[21] Association of Official Analytical Chemists . Official Methods of Analysis of the Association of Official Analytical Chemists Volume 2; AOAC International: Gaithersburg, MD, USA, 2000; . https://publications.iupac.org/ci/2001/march/new_book_aoac.html..
[22] Fontanari, G.G.; Martins, J.M.; Kobelnik, M.; Pastre, I.A.; Arêas, J.A.G.; Batistuti, J.P.; Fertonani, F.L. Thermal Studies on Protein Isolates of White Lupin Seeds (Lupinus albus). J. Therm. Anal. Calorim. 2011, 108, 141–148. [CrossRef]
[23] Dean, A.; Voss, D. Fractional Factorial Experiments. Design and Analysis of Experiments ; Springer: Berlin/Heidelberg, Germany, 1999; 483–545. . [CrossRef]
[24] Al-Sabur, R.; Slobodyan, M.; Chhalotre, S.; Verma, M. Contact Resistance Prediction of Zirconium Joints Welded by Small Scale Resistance Spot Welding Using ANN and RSM Models. Mater. Today Proc. 2021, 47, 5907–5911. [CrossRef]
[25] Al-Sabur, R. Tensile Strength Prediction of Aluminium Alloys Welded by FSW Using Response Surface Methodology–Comparative Review. Mater. Today Proc. 2021, 45, 4504–4510. [CrossRef]
[26] Marinkovic, V. A Novel Desirability Function for Multi-Response Optimization and Its Application in Chemical Engineering. Chem. Ind. Chem. Eng. Q. 2020, 26, 309–319. [CrossRef]
[27] Derringer, G.; Suich, R. Simultaneous Optimization of Several Response Variables. J. Qual. Technol. 1980, 12, 214–219. [CrossRef]
[28] Singleton, V.L.; Rossi, J.A. Colorimetry of Total Phenolics with Phosphomolybdic-Phosphotungstic Acid Reagents. Am. J. Enol. Vitic. 1965, 16, 144–158. [CrossRef]
[29] Pękal, A.; Pyrzynska, K. Evaluation of Aluminium Complexation Reaction for Flavonoid Content Assay. Food Anal. Methods 2014, 7, 1776–1782. [CrossRef]
[30] Rufino, M.S.M.; Alves, R.E.; Fernandes, F.A.N.; Brito, E.S. Free Radical Scavenging Behavior of Ten Exotic Tropical Fruits Extracts. Food Res. Int. 2011, 44, 2072–2075. [CrossRef]
[31] Fonseca, J.d.M.; Pereira, C.D. . Biorefino dos Resíduos da Semente de Pracaxi (Pentaclethra macroloba (Wild.) Kuntze)—Um fruto da Amazônia ; Federal University of Santa Catarina, Technological Center, Department of Chemical Engineering and Food Engineering: Florianópolis, Brazil, 2024; . https://repositorio.ufsc.br/handle/123456789/258989..
[32] Mohammadnezhad, P.; Valdés, A.; Barrientos, R.E.; Ibáñez, E.; Block, J.M.; Cifuentes, A. A Comprehensive Study on the Chemical Characterization and Neuroprotective Evaluation of Pracaxi Nuts Extracts Obtained by a Sustainable Approach. Foods 2023, 12. 3879 [CrossRef]
[33] de Souza Eberhart, B.; Komiyama, C.M.; Burbarelli, M.F.d.C.; Heiss, V.A.R.C.; Garcia, R.G.; Borges, R.; Felix, G.A.; Cardoso, C.A.L.; Braz, P.H.; Teodoro, C.R.; et al. Characterization and Subchronic Oral Toxicity of Pentaclethra macroloba (pracaxi) Oil in Rattus Norvegicus (lin. Wistar). Toxicon 2023, 230, 107151. [CrossRef]
[34] Teixeira, G.L.; Maciel, L.G.; Mazzutti, S.; Gonçalves, C.B.; Ferreira, S.R.S.; Block, J.M. Composition, Thermal Behavior and Antioxidant Activity of Pracaxi (Pentaclethra macroloba) Seed Oil Obtained by Supercritical CO2. Biocatal. Agric. Biotechnol. 2020, 24. 101521 [CrossRef]